Last week, we took a closer look at how one must approach trading Breakouts and why a Scanner is a useful tool to find stocks that are in breakout mode.
This week let’s dig deeper into some of the Price Volume Breakout scans available on the Market Pulse app to discover breakout stocks.
Breakouts can be broadly classified into the following categories:
- Daily Price Volume Breakouts
- Intraday Breakouts
- Narrow Range Breakouts
- 52 week breakouts
Daily Breakouts
Price Volume Breakout
You can run this scan from the Market Pulse app as follows:Scanner > All Scans > Breakout Scans > Price Volume Breakout
This is an EOD scan that helps you find stocks that has broken through the high of its previous 120 days(~ 6 months) of trading in the last one week, and has shown a considerable increase in trading volume and closed strongly on the previous trading day.
I recommend you shortlist the stocks from the Scanner results and analyze the charts further to zero in on the charts that have clear identifiable patterns.
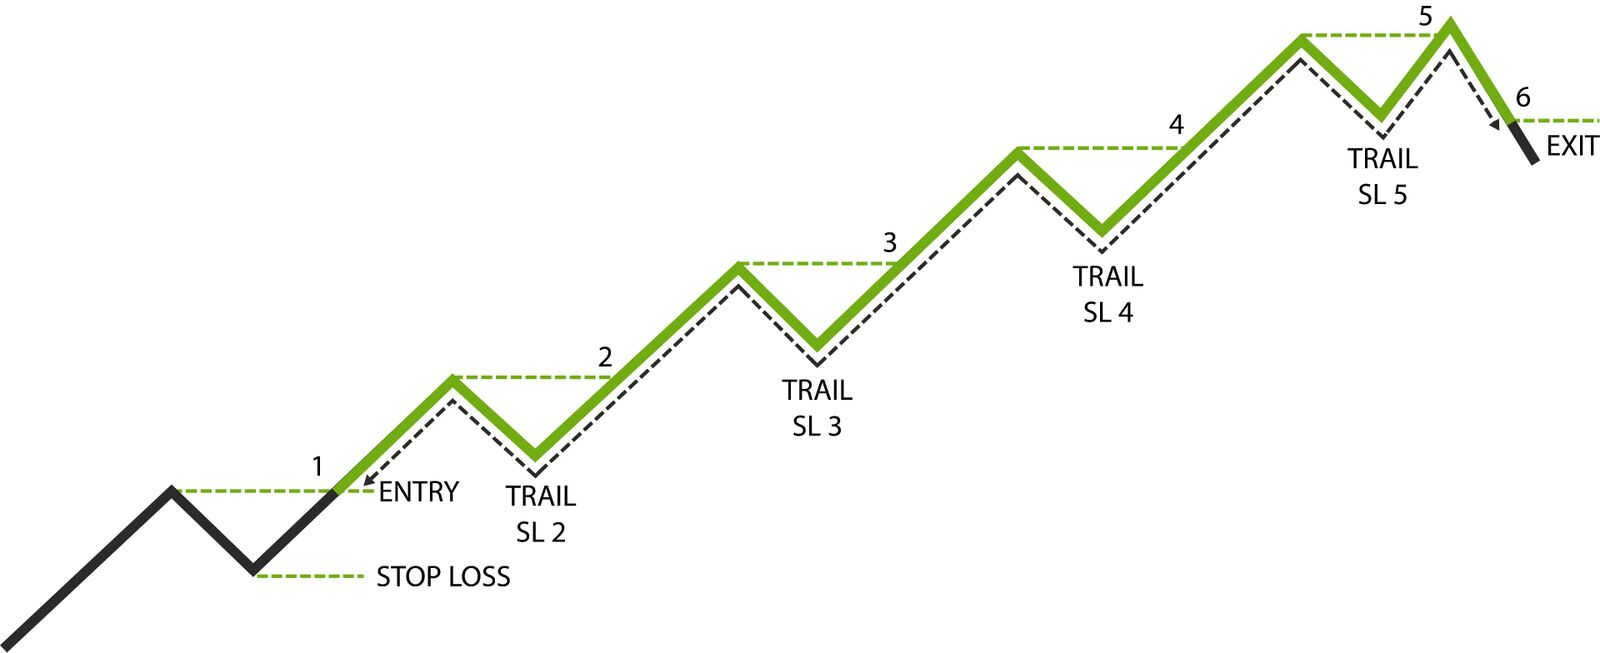
Positional traders can use this scan to enter into long trends once it’s confirmed at an early stage. You can define your stop loss below a previous swing as shown in Fig 1. and keep trailing the stop as the stock crosses a previous swing high. As seen in Fig 1., once the stock crosses points 2, 3, 4 & 5, the stop losses are trailed to SL2, SL3, SL4 and SL5 respectively.
This is a perfect scan for traders who have full time jobs and cannot spend more than an hour a day to track the markets. Though the ratio of number of winning trades to losing trades will be low (<1), the gains on the winning trades can be several multiples of the losses making this an excellent strategy.
Day traders, can use intraday pullbacks and corrections to find low risk entries for their long trades in such stocks. It’s important to remember not to chase prices and exercise patience. A missed opportunity is better than a losing trade.

2 Month Price Volume Breakout
This EOD scan is almost identical to the Price Volume breakout except for the time period of the breakout. As suggested by the name, the scan outputs stocks that have broken the highs of the last 2 months (50 days to be precise).
Traders should not be in a hurry when using an end-of-day(EOD) scanner. These scans are meant to assist in the research and planning for next day’s trading. Since the results are based on closing prices, there is no immediate opportunity to trade the stocks.
Intraday Breakouts
Sharp Price Gain/Fall on Large Volumes
This is a simple scan that looks at the stocks that are either rising or falling sharply with large volumes. Price gain is defined in terms of percentages whereas Volume is seen in comparison to a simple moving average(SMA) of volume.
Preferred Timeframe: Intraday timeframe, preferably 15/30 mins at 9.30 am or 60 mins at 10am to pick the movers of the day.
The results of this scan must be analyzed further before taking your decision whether you want to trade a stock. I suggest you also watch this video walk through on this scan I have created to get a better understanding of how I go about using this scan.
We’ll continue giving you more insights into the use of Scanners for Breakouts in the coming weeks.