The first half of this course focussed on some of the best breakout strategies used by professional traders. Today and in the next few articles we’ll see how we can use technical strategies to define our scans and find trading opportunities.
The indicator I want to discuss this week is nothing short of awesome and it is the Awesome oscillator.
Let’s take a look at how the indicator is constructed, what are the different ways it can be interpreted to make trading strategies and finally how we can use the scanner to combine it with other indicators to make robust strategies.
Origin
The Awesome Oscillator was developed by Bill Williams - who was a visionary trader who combined psychology with technical analysis to come up with his theory known as Chaos Theory. The Awesome Oscillator was one of the dimensions of the market structure defined by him in his book Trading Chaos. Primarily, the Awesome Oscillator is an indicator used to measure market momentum.

Construction
AO calculates the difference of a 34 Period and 5 Period Simple Moving Averages. The Simple Moving Averages that are used are not calculated using closing price but rather each bar's midpoints i.e (High + Low)/2
The fact that it's based off of the average of high and low makes it stronger in markets that have more regular movements and more regular candle sizes.
If you're trading in a market where candle size varies a lot then the awesome oscillator may not be the best for these markets because it's going to skew those moving averages.
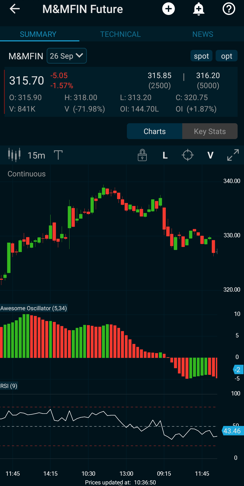
So if you see this image, the Awesome Oscillator is designed to have values that fluctuate above and below a Zero Line. The generated values are plotted as a histogram of red and green bars.
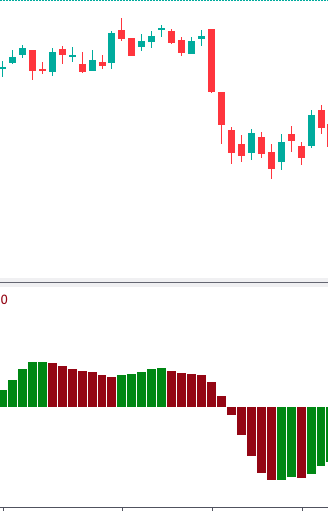
A bar is green when its value is higher than the previous bar.
A red bar indicates that a bar is lower than the previous bar.
The awesome oscillator isn't bounded by two values. It doesn't have to stay between 0 and 100 since it is the difference between two moving averages and just the difference can go ashigh as it needs to or as low as it needs to based off of that zero point.
Now let’s check out 4 strategies associated with Awesome oscillator:They are:
- Zero Line Crossovers
- Twin Peaks
- Saucers
- Divergences
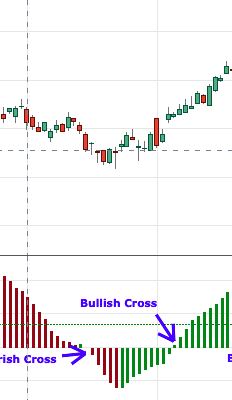
Zero Line Crossover
The simplest signal is when the value of the oscillator crosses the zero level. This gives us two easy-to-follow trading signals:
- Crossing from negative to positive is a bullish signal
- Crossing from positive to negative is a bearish signal
Twin Peaks Patterns
This strategy requires you to look for two peaks on the same side of the zero line. An additional requirement is that the reversal between the peaks must also be on the same side of the zero line. A bullish twin peaks signal has the peaks below the zero line, for which the second peak must be higher(less negative) than the first peak. It must also be followed by a green bar. A bearish twin peaks signal is the opposite of this — the two peaks must be above the zero line. Likewise, the second peak must be lower than the first peak, and then followed by a red bar.
Saucers
This strategy searches for quick changes in the momentum and requires a specific pattern in three consecutive bars of the AO histogram, all on the same side of the zero line. A bullish saucer requires all three bars to be on the positive side of the zero line. The construction you are looking for is a red bar, followed by a smaller red bar, followed by a green bar. A bearish saucer requires all three bars to be on the negative side of the zero line. The combination needs to be a green bar, followed by a smaller green bar(i.e. less negative in value), followed by a red bar.
Price and Momentum Divergence
As with most momentum indicators, divergence between the price and the momentum can also be a useful clue as to what's going on in the market. For example, if we see the price making new highs, but the AO indicator fails to make new highs, this is a bearish divergence. Similarly, if the price sets new lows and the AO fails to follow suit, this is a bullish divergence.
No signal is set in stone. Remember to always combine this with other indicators for confirmation.
Scanning for Awesome Oscillator Strategies
You can check out the video below to see how you can use the scanner for trading AO strategies.